We use cookies to enhance the usability of our website. If you continue, we'll assume that you are happy to receive all cookies. More information. Don't show this again.
General description of the gene and the encoded protein(s) using information from HGNC and Ensembl, as well as predictions made by the Human Protein Atlas project.
Gene namei
Official gene symbol, which is typically a short form of the gene name, according to HGNC.
Assigned HPA protein class(es) for the encoded protein(s).
Enzymes Metabolic proteins Plasma proteins
Predicted locationi
All transcripts of all genes have been analyzed regarding the location(s) of corresponding protein based on prediction methods for signal peptides and transmembrane regions.
Genes with at least one transcript predicted to encode a secreted protein, according to prediction methods or to UniProt location data, have been further annotated and classified with the aim to determine if the corresponding protein(s) are secreted or actually retained in intracellular locations or membrane-attached.
Remaining genes, with no transcript predicted to encode a secreted protein, will be assigned the prediction-based location(s).
The annotated location overrules the predicted location, so that a gene encoding a predicted secreted protein that has been annotated as intracellular will have intracellular as the final location.
Intracellular
Number of transcriptsi
Number of protein-coding transcripts from the gene as defined by Ensembl.
4
HUMAN PROTEIN ATLAS INFORMATIONi
Summary of data presented in the Tissue section, with a representative image of protein expression (left) and an interactive chart showing the tissue-specific mRNA expression (right). The image and the chart are clickable and will redirect to more Tissue data. This section contains information regarding the expression profiles of protein-coding genes in normal human tissue, both on the mRNA and protein level. The protein expression data is derived from antibody-based protein profiling using immunohistochemistry.
Tissue expression cluster (RNA)i
The RNA data was used to cluster genes according to their expression across tissues. Clusters contain genes that have similar expression patterns, and each cluster has been manually annotated to describe common features in terms of function and specificity.
Testis - Spermatogenesis (mainly)
Tissue specificity (RNA)i
The RNA specificity category is based on mRNA expression levels in the consensus dataset which is calculated from the RNA expression levels in samples from HPA and GTEX. The categories include: tissue enriched, group enriched, tissue enhanced, low tissue specificity and not detected.
Tissue enriched (testis)
Tau specificity score (RNA)i
Tau specificity score is a numerical indicator of the specificity of the gene expression across cells or tissues. The value ranges from 0 and 1, where 0 indicates identical expression across all cells/tissue types, while 1 indicates expression in a single cell/tissue type.
0.93
Tissue distribution (RNA)i
The RNA distribution category is based on mRNA expression levels in the analyzed samples based on a combination of data from HPA and GTEX. The categories include: detected in all, detected in many, detected in some, detected in single and not detected.
Detected in some
Protein evidencei
Evidence score for genes based on UniProt protein existence (UniProt evidence); neXtProt protein existence (neXtProt evidence);and a Human Protein Atlas antibody- or RNA based score (HPA evidence). The avaliable scores are evidence at protein level, evidence at transcript level, no evidence, or not avaliable.
Main subcellular location based on data generated in the subcellular section of the Human Protein Atlas.
Localized to the Nucleoli, Plasma membrane In addition localized to the Nucleoplasm
Secretome annotationi
All genes with at least one predicted secreted isoform have been annotated and classified with the aim to determine if the corresponding protein(s) are:
secreted into blood
locally secreted
or actually being attached to membrane or retained in intracellular locations like mitochondria, endoplasmatic reticulum (ER), Golgi apparatus or lysosomes.
Not available
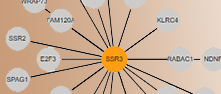
INTERACTION SUMMARYi
In the Interaction summary a network plot of the gene's interaction partners is shown with nodes representing genes and edges representing the interaction type and the confidence (MI score) for the interaction. The type of interaction (direct interaction or physical association) is reflected by the colour of the edges, while the confidence of the interaction is reflected by the thickness of the edges. Scores larger than 0.6 (high confidence) have a thicker line than scores between 0.45 and 0.6 (medium confidence).
The highlight bar in the top of the plot can be used to colour the nodes according to subcellular location (based on data in the Subcellular section), predicted location (based on signalpeptide and transmembrane region predictions), tissue specificity (based on RNA tissue expression profiles) or proteinclass.
Nodes can also be highlighted using the top left Filter option in which a query of choice can be built to for example label all nodes that are tissue enriched in both human and mouse brain or those that belongs to a certain tissue expression cluster. The expression cluster for the gene is stated in the box Human Protein Atlas Information above the network plot. Click on Filter in the top left in the plot to find the query builder and some example queries.
NT5C1B has no defined protein interactions.
METABOLIC SUMMARYi
In this summary the pathway/subsystems to which the gene belongs is shown together with the associated cellular compartment for the reactions based on metabolite information. The number of proteins and metabolites in the pathway is shown as well as the number of reactions for the selected gene. By clicking on a pathway in the summary table the associated metabolic network map is shown, together with a gene-tissue heatmap that shows the expression of genes in that pathway in different tissues.


 The Human Protein Atlas project is funded